
1.Google Analytics Home
In the last 28 Days, 105 Users have read this blog, creating 184 sessions with a bounce rate of 38.04% and session duration of 2m 17s.
 |
| FIG.1 |
1.1. Active Users
The below image gives an analysis of page views per minute. For instance, six active users are viewing four different blogs for the given minute.
 |
| FIG.2 |
1.2. How do you acquire users?
There are three different ways to acquire users, namely:
1.2.1. Traffic Channel
The below histogram indicates maximum traffic is caused by direct and social channels.
 |
| FIG.3 |
1.2.2. Source/Medium
Views have been escalated through the use of Direct and Instagram.
 |
| FIG.4 |
1.2.3. Referral
 |
| FIG.5 |
1.3. How are your active users trending over time?
The line graph displays the number of active users over 90 days.
 |
| FIG.6 |
1.4. How well do you retain users?
The below statistic gives the percentage of returning users for 6 different weeks.
 |
| FIG.7 |
1.5. When do your users visit?
The below analysis shows that maximum users have visited the blog between 4pm-7pm.
 |
| FIG.8 |
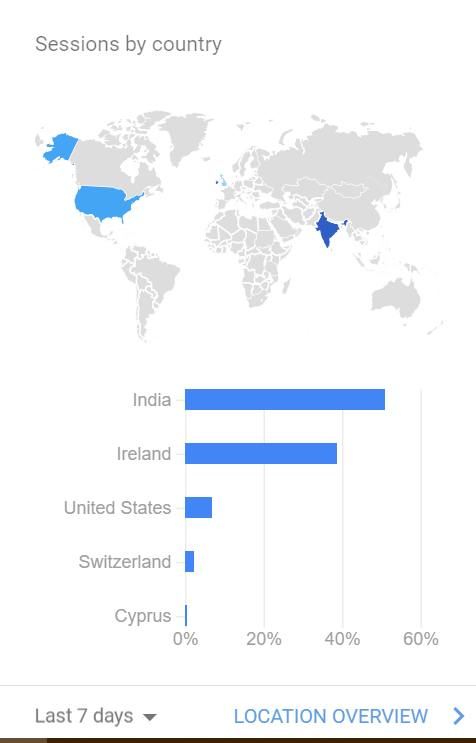
1.6. Where are your users?
The below geographical map indicates that maximum users are from India followed by Ireland for the last 7 days.
 |
| FIG.9 |
1.7. What are your top devices?
The below pie chart indicates that 85% of users have visited the page using a mobile device and the rest using a desktop.
 |
| FIG.10 |
1.9. What pages do your users visit?
The below report indicated the number of page views per site.
 |
| FIG.11 |
2. Real-Time Overview
The below Dashboard gives detailed information about the active users.
The below Dashboard gives detailed information about the active users.
 |
| FIG.12 |
3. Audience Overview
The Below dashboard gives a statistical view about users and their function on the Blog page.
The Below dashboard gives a statistical view about users and their function on the Blog page.
 |
| FIG.13 |
3.1. Active Users
 |
| FIG.14 |
3.2. Demographics Overview
Below is the Density chart for age and pie chart for gender.
 |
| FIG.15 |
3.3. Geo
3.3.1. Language
Below report gives a comparative study of literature on the basis on acquisition, behaviour and conversion.
Below report gives a comparative study of literature on the basis on acquisition, behaviour and conversion.
 |
| FIG.16 |
3.3.2. Location
Below report gives a comparative study of location on the basis on acquisition, behaviour and conversion
 |
FIG.17
|
3.4. Behaviour
3.4.1. New and Returning Users
The below chart gives a detailed report on the different types of users.
The below chart gives a detailed report on the different types of users.
 |
| FIG.18 |
3.4.2. Frequency and Recency
This Dashboard gives a comparative study of pageviews created per session.
This Dashboard gives a comparative study of pageviews created per session.
 |
| FIG.19 |
3.4.3. Engagement
The below report gives session durations on per sessions, causing the changes in the number of pageviews.
The below report gives session durations on per sessions, causing the changes in the number of pageviews.
 |
| FIG.20 |
3.5. Technolgy
3.5.1. Browsers and OS
Below report gives a comparative study of different browsers on the basis on acquisition, behaviour and conversion.
Below report gives a comparative study of different browsers on the basis on acquisition, behaviour and conversion.
 |
| FIG.21 |
3.5.2. Network
Below report gives a comparative study of the different network on the basis on acquisition, behaviour and conversion.
Below report gives a comparative study of the different network on the basis on acquisition, behaviour and conversion.
 |
| FIG.22 |
3.6. Mobile Overview
Below report gives a comparative study of different devices used to view the blog
 |
| FIG.23 |
3.6.1. Devices used in detail
 |
| FIG.24 |
4.1.Behaviour Overview
 |
| FIG.25 |
Comments
Post a Comment